Data Quality Reminders
Data below is captured from IRS 990/990-EZ forms, or in select cases from MA PC charitable tax forms, or an organization’s own published reports. Thus while these columns are likely comparable, they are not necessarily exactly compatible. A few examples of likely subtle differences:
- IRS 990 and 990-EZ fields sometimes have very similar, but not identical definitions. For example, the “Contributions, gifts, grants, and similar amounts received” field differs because one version includes “Membership Dues”, and the other form does not. For more details, see the Propublica Nonprofit Explorer API and read the various links discussing IRS field mapping.
- 990 filings are often made late, and take time to show up publicly; thus data for different orgs may be reported for different years.
- Where 990 filings are not available, we’ve used the MA AGO’s PC forms, or reports from the organization directly. Thus some of these values may be subtly different from what gets put on their final 990.
- Contributions is a large category; in particular, nonprofit news sites often think of grants and leading/major gifts separately from individual, sustaining, or regular subscriber donations.
- A few nonprofit newsrooms publish weekly physical papers, with delivery either to select places, subscribers, or to all residents. This obviously changes their finances, especially expenses as well as potential for advertising revenue.
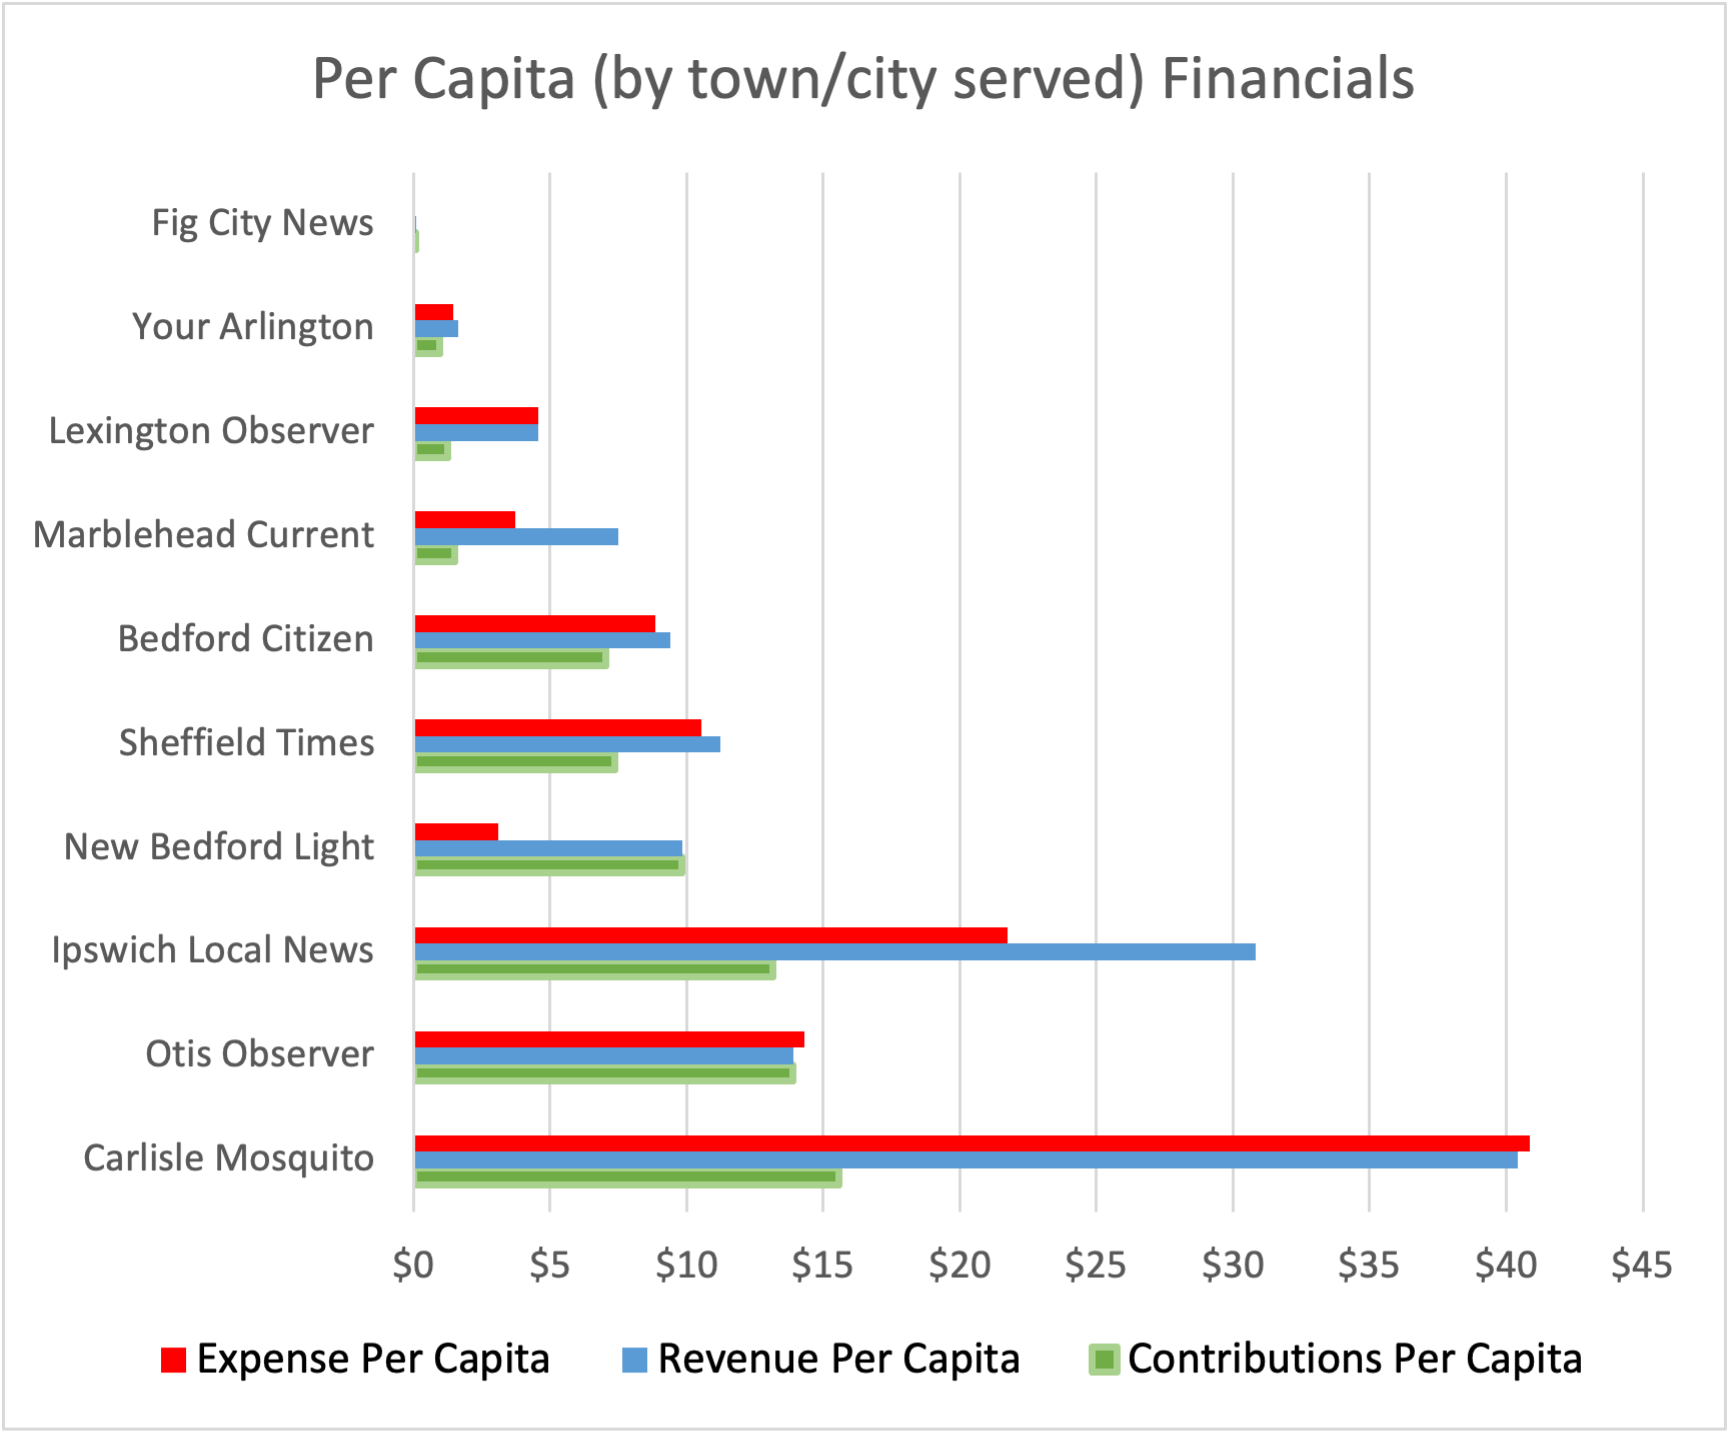
Comparative Financials Of Selected Local News
Data Columns Notes
- irsdate is when the organization got 501(c)3 status
- population and *percapita data come from MA DLS
- most data comes from IRS 990 forms
- computed data in the last columns is computed per capita in the primary town served
You can download this CSV data file.